简体中文
繁體中文
English
Pусский
日本語
ภาษาไทย
Tiếng Việt
Bahasa Indonesia
Español
हिन्दी
Filippiiniläinen
Français
Deutsch
Português
Türkçe
한국어
العربية
Heikin Ashi Candlestick Chart vs. Traditional Japanese Candlestick Chart
Abstract:What distinguishes Heikin Ashi from an average candlestick? Let's compare and contrast a Heikin Ashi candlestick chart with an average Japanese candlestick chart.
What distinguishes Heikin Ashi from an average candlestick?
Let's compare and contrast a Heikin Ashi candlestick chart with an average Japanese candlestick chart.
Let's look at some authentic charts because an image is worth a thousand pips.
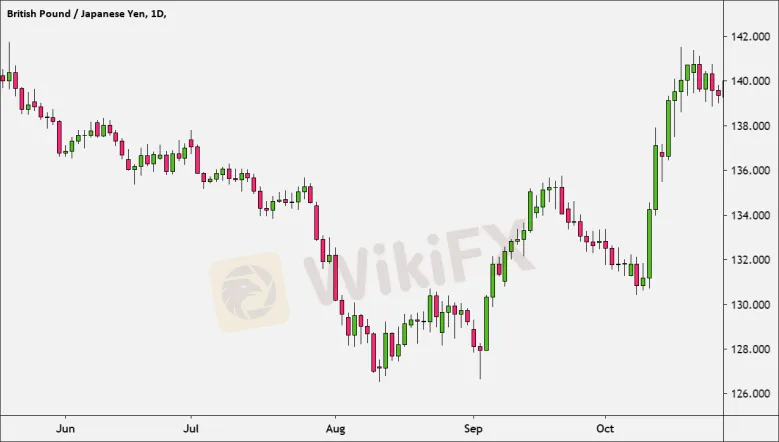
First, here's a daily (1D) chart of the GBP/JPY in traditional Japanese style:

The same GBP/JPY rate is shown on a Heikin Ashi candlestick chart:

Let's compare and contrast them:

The classic Japanese candlestick chart is on the LEFT, while the Heikin Ashi chart is on the RIGHT.
The chart on the right shows how directional moves are smoothed out in a way that the data on the left does not.
Traditional Japanese candlestick charts' candles frequently alter color from green to red (up or down), making them difficult to read.
Candles on the Heikin Ashi chart, on the other hand, display more consecutive colored candles, making it easier for traders to spot historical price moves.
You'll notice that the candles on Heikin Ashi charts prefer to stay green during uptrends and red during downtrends.
Traditional Japanese candlesticks, on the other hand, interchange color even if the price is firmly moving in one way.
The color of the candlesticks can change almost as often as Kylie Jenner's hair color.
The chart above is a candlestick chart, which you probably didn't see.
Anyway, back to the comparison chart...

In terms of price action, you can clearly notice that the Heikin Ashi chart is considerably smoother.
This is why some forex traders choose to use Heikin Ashi candles since they reduce chart noise and allow them to more clearly assess trends.
The way the price is displayed in terms of the open and close distinguishes Heikin Ashi from an average Japanese candlestick chart.
If you look closely at the Heikin Ashi chart, you'll note that each candlestick begins at the MIDDLE of the candlestick before it, rather than at the level where the preceding candlestick ended.

Because of the way Heikin Ashi candlesticks are calculated, they “act” in this fashion.
You'll learn how to compute Heikin Ashi in the following session, so you can impress your friends at dinner parties.
Disclaimer:
The views in this article only represent the author's personal views, and do not constitute investment advice on this platform. This platform does not guarantee the accuracy, completeness and timeliness of the information in the article, and will not be liable for any loss caused by the use of or reliance on the information in the article.
Read more

Forex is a game that I enjoy playing
These champions have one thing in common: they not only work their butts off, but they also enjoy what they do.

Wait patiently. Maintain your discipline
"Patience is the key to everything," American comic Arnold H. Glasgow once quipped. The chicken is gotten by hatching the egg rather than crushing it."

There isn't a Holy Grail to be found!
Ask any Wall Street quant (the highly nerdy math and physics PhDs who build complicated algorithmic trading techniques) why there isn't a "holy grail" indicator, approach, or system that generates revenues on a regular basis.

Concentrate on the Process. Profits aren't a priority
We've designed the School of WikiFX as simple and enjoyable as possible to help you learn and comprehend the fundamental tools and best practices used by forex traders all over the world, but keep in mind that a tool or strategy is only as good as the person who uses it.
WikiFX Broker
Currency Calculator


