简体中文
繁體中文
English
Pусский
日本語
ภาษาไทย
Tiếng Việt
Bahasa Indonesia
Español
हिन्दी
Filippiiniläinen
Français
Deutsch
Português
Türkçe
한국어
العربية
Crude Oil Remains Conflicted by Key Technical Levels
Abstract:Following the invasion of Ukraine in late Feb, oil prices have continued to soar, with both WTI and Brent finding support above the $100 p/b (per barrel) mark.
CRUDE OIL PRICE ANALYSIS:
Oil prices remain supported by further supply constraints but key technical levels hold firm
US Crude (WTI)aims to clear the $110 psychological handle but will bullish momentum prevail?
Price actionremains encapsulated between Fibonacci levels of historical moves
{{GUIDE|OIL|}}
OIL TECHNICAL & FUNDAMENTALS COLLIDE
As condemnation against the Kremlin continues to rise, the embargo against Russian energy and gas from Western allies and European counterparts (including Germany, one of the primary importers of Russian energy) has exacerbated concerns that inflationary pressures may continue to mount.
US CRUDE OIL (WTI) TECHNICAL ANALYSIS
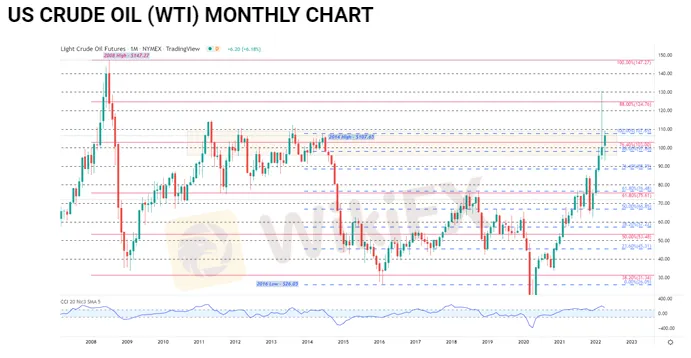
Although fundamental factors are likely to remain as a prominent driver of price action, the monthly chart below highlights how key technical levels from historical and short-term moves have assisted in providing firm levels of support and resistance for price action, holding both bulls and bears at bay.
After rising above the 2014 high of $107.65 in early March, failure to gain traction above $120 enabled sellers to drive prices lower, before stabilizing around the $100 handle.
With both key psychological and Fibonacci levels currently in play, the monthly CCI (commodity channel index) remains in overbought territory, suggesting that although the uptrend remains intact (for now), bulls may be losing steam.

While inflation currently remains at decade highs, supply constraints have been exacerbated by the ongoing conflict between Russia and Ukraine, providing an additional catalyst for price action.

As prices continue to whipsaw between the Fib levels of both the historical (2008 – 2020) and 2014 – 2016 move, the $94 - $108 range will likely continue to hold firm with a break towards either side increasing the probability of a breakout.
In order for upward trajectory to hold, bulls will need to conquer the $108 and $110 level, with the next level of resistance holding firm at $116,58 (the 14.4% Fib of the 2008 – 2020 move). If this level is broken, a break of the psychological $120 mark could leave the door open for a retest of the 2022 high at $130.5.

However, for bearish momentum to gain traction, sellers would need to drive prices below $100 which could then bring $93.56 (the 38.2% retracement of the Nov 2020 – 2022 move) into play. If prices continue to fall below $90.00 and $88.39 (23.6% Fib of the 2014-2016 move), it is possible for WTI to retest $80.00.

Disclaimer:
The views in this article only represent the author's personal views, and do not constitute investment advice on this platform. This platform does not guarantee the accuracy, completeness and timeliness of the information in the article, and will not be liable for any loss caused by the use of or reliance on the information in the article.
Read more

INFINOX Partners with Acelerador Racing for Porsche Cup Brazil 2025
INFINOX has teamed up with Acelerador Racing, sponsoring an Acelerador Racing car in the Porsche Cup Brazil 2025. This partnership shows INFINOX’s strong support for motorsports, adding to its current sponsorship of the BWT Alpine F1 Team.

The Daily Habits of a Profitable Trader
Every professional trader follows a structured approach to ensure they are well-prepared, disciplined, and able to seize opportunities with confidence. Whether you are a seasoned investor or an aspiring trader, adhering to a robust daily checklist can significantly enhance your performance. Use this checklist to check if you are a qualified trader

The Impact of Interest Rate Decisions on the Forex Market
Interest rate changes determine currency attractiveness, influencing capital flows and exchange rate trends. Understanding this mechanism helps investors navigate the forex market effectively.

How a Housewife Lost RM288,235 in a Facebook Investment Scam
A 47-year-old housewife in Malaysia recently fell victim to an online investment scam, losing a substantial sum of RM288,235 after engaging with a fraudulent scheme advertised on Facebook.
WikiFX Broker
Latest News
TradingView Brings Live Market Charts to Telegram Users with New Mini App
Trump tariffs: How will India navigate a world on the brink of a trade war?
Interactive Brokers Launches Forecast Contracts in Canada for Market Predictions
Authorities Alert: MAS Impersonation Scam Hits Singapore
Stocks fall again as Trump tariff jitters continue
INFINOX Partners with Acelerador Racing for Porsche Cup Brazil 2025
Regulatory Failures Lead to $150,000 Fine for Thurston Springer
April Forex Trends: EUR/USD, GBP/USD, USD/JPY, AUD/USD, USD/CAD Insights
March Oil Production Declines: How Is the Market Reacting?
Georgia Man Charged in Danbury Kidnapping and Crypto Extortion Plot
Currency Calculator


