简体中文
繁體中文
English
Pусский
日本語
ภาษาไทย
Tiếng Việt
Bahasa Indonesia
Español
हिन्दी
Filippiiniläinen
Français
Deutsch
Português
Türkçe
한국어
العربية
Bitcoin Technical Analysis for April 2022
Abstract:Can Bitcoin overtake a key $50,000 level this month?
Bitcoin Key Price Levels
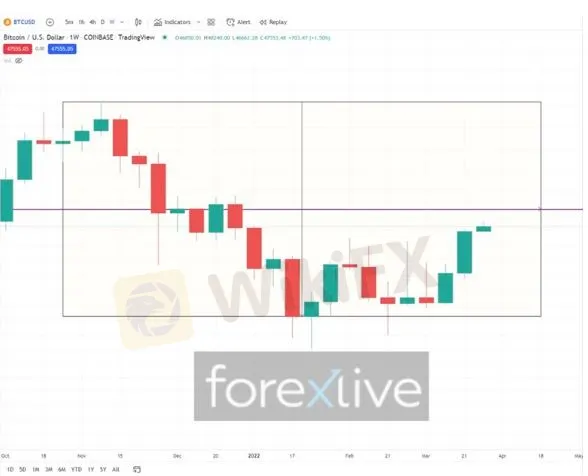
Round numbers act as ‘magnets’ that, often, pull assets to them, especially when they are close. At Bitcoins current price being less than 5% below the round 50k mark, that is a magnet supporting many traders and media publishers thinking and discussing the possibility of Bitcoin reaching $50,000, as marked below by the horizontal purple line.
Note also that the BTCUSD key price level of 50k is the middle of the range of the weekly chart, whereby its high is the all time high (ATH) of 69k reached in Nov 2021 and the lowest open of any weekly candle since.

Bitcoin Price Trend
A trend is the price movement of a market or an asset in its general direction. Trendlines and/ channels that emphasize when the price is moving up, down, or sideways are used in technical analysis to identify trends.
Bitcoin continues to be trending up, on the daily timeframe, since 24 January 2022. However, traders should watch how Bitcoin price reacts if and when it reaches the upper band of the illustrated channel, since some traders and trading algorithms who have been in Long positions, may close or reduce their positions (thus selling, and increasing downwards pressure on the bitcoin price).

Bitcoin Candlestick Pattern
A candlestick pattern is a graphical representation of price movement on a candlestick chart that many traders see as anticipating market action, based on historic patterns and price reactions.
Currently, on the monthly chart, Bitcoin is demonstrating a ‘bullish harami’, which is a candlestick chart indication that may be used to detect bear trend reversals, meaning trend transitions from a downtrend to an uptrend.

Bitcoin Moving Averages
The goal of a simple moving average (SMA) is to calculate an average of the market's price over recent periods in order to discern the market's trend. The exponential moving average (EMA) is intended to give greater weight to current and most recent price data, which is seen to be more meaningful than older data. As a result, the EMA “reacts faster” to price movements.
Currently, Bitcoin price on the daily chart is above the 9 EMA, which is above the 20 EMA, so the bitcoin price daily trend is still quite bullish, according to these popular moving averages.

Bitcoin Volume Profile
Volume profile, sometimes referred to as market profile, is an advanced charting analysis that shows trade activity over a set time period and at certain price levels.
The VAH is the ‘Value Area High’, which is the highest price in the Value Area, and traders often utilize it as a resistance level. Oftentimes, the price likes to “pierce” these resistances, trapping new bulls that enter a Long and bet on a breakout up above the resistance.
The below shows the volume profile of Bitcoin since the beginning of 2022, where price may have pierced the previous VAH, and might in the near future find profit takers and trapped bulls (thus declining), even temporarily.

Disclaimer:
The views in this article only represent the author's personal views, and do not constitute investment advice on this platform. This platform does not guarantee the accuracy, completeness and timeliness of the information in the article, and will not be liable for any loss caused by the use of or reliance on the information in the article.
Read more

Twin Scam Alert: Broker Capitals is a New Domain of Finex Stock
This week, the Italy financial regulator CONSOB issued a warning against an unlicensed broker named Broker Capitals. When we clicked on Broker Capitals' website, its logo, trade name, and design seemed familiar to us.

Berkshire CEO-designate Abel sells stake in energy company he led for $870 million
Berkshire Hathaway Inc said on Saturday that Vice Chairman Greg Abel, who is next in line to succeed billionaire Warren Buffett as chief executive, sold his 1% stake in the company’s Berkshire Hathaway Energy unit for $870 million.

Paying particular heed to payrolls
A look at the day ahead in markets from Alun John

Dollar extends gains against yen as big Fed hike bets ramp up
The dollar extended it best rally against the yen since mid-June on Monday, buoyed by higher Treasury yields after blockbuster U.S. jobs data lifted expectations for more aggressive Federal Reserve policy tightening.
WikiFX Broker
Latest News
Trump Urges OPEC to Lower Oil Prices
British Museum hit by alleged IT attack by ex-worker
Philippine POGO Scam Targets Over 5,000 Australians
eToro has teamed up with Stocktwits to Expand Retail Trading Access
Italy’s CONSOB Orders Blockage of Five Unauthorized Investment Websites
Can You Really Trust Offshore Brokers?
5 Overlooked Details That Could Make or Break Your Trades
Are Forex Broker Bonuses Worth the Risk?
Dukascopy Adds 31 New ETFs to the JForex Platform
Understand How Expert Advisors and Automated Trading Work Together
Currency Calculator


